Implementing price caps on medical services will significantly reduce overall healthcare costs
What's this about?
People disagree about whether price caps can cut total health costs. A price cap sets the most a doctor or hospital may charge.
What supporters say
- Caps can stop some hospitals from charging very high prices, which can lower bills for health plans and sick people.
- Wide price rules can slow the rise of medical bills across the whole care system.
- A full payment plan may also cut waste by limiting both the price and amount of care.
What critics say
- Lower prices may lead doctors and hospitals to give more care, so total costs may not fall.
- Caps may not stop low-value care, such as tests or visits that help little.
- Care groups may change patient codes or move care into areas without price caps.
- Some care groups may leave a plan if the cap pays too little, which may cut choice.
How to read this
The number of points on each side does not show who is right; strong proof matters more than a long list.
The bottom line
Price caps can lower some bills, but they do not reliably cut all health costs by themselves.
The evidence leans against the claim because lower prices may lead to more care or leave waste untouched.
The claim is that putting legal limits on what providers can charge would significantly lower total health spending. The evidence suggests a more qualified picture: price controls can reduce payments for some services, but they do not reliably reduce spending across the whole healthcare system on their own.
The case for
Broad, coordinated price regulation can slow the growth of medical payments. Japan’s all-payer fee schedule, which sets prices across the healthcare system, has been linked to tighter control of medical spending. Repeated government revisions to the schedule helped contain growth, although Japan’s system is far more centralized than that of the United States. That difference makes it difficult to assume the same results would follow from narrower American price caps. 1 (see Figure 1)
Price caps may also produce immediate savings when hospitals have strong bargaining power and charge unusually high rates. Limiting those rates can reduce what insurers and patients pay for covered services. Research on rate-setting and similar all-payer policies describes them as tools for restraining excessive hospital prices and giving insurers more equal negotiating power. But the results depend heavily on how the rules are designed and how providers respond. 2
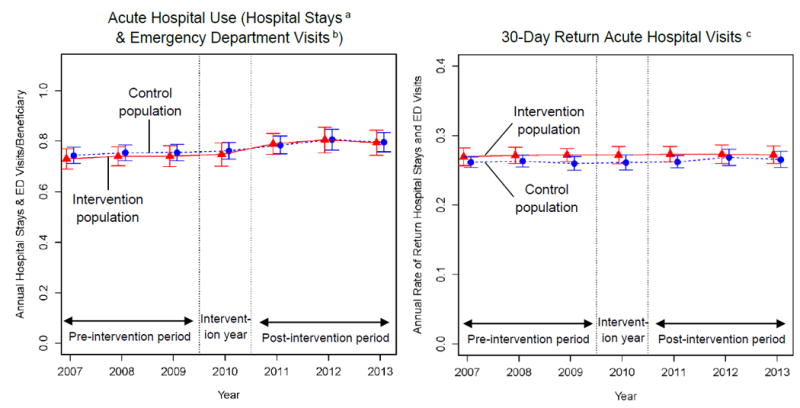
A broader payment system can sometimes affect the amount of care delivered, not just its price. Maryland’s rural-hospital global-budget program, for example, was associated with reduced hospital use in some settings. That suggests a payment regime combining limits on revenue and volume may lower spending beyond simply cutting the price of an individual procedure. (see Figure 2)
The case against
Lower prices do not automatically mean lower total spending. Providers may respond by delivering more services, changing how they code patients, shifting patients toward services outside the cap, or reducing participation in a market. Patients and providers may also substitute one form of care for another. These responses can offset some or all of the initial savings from a price limit. Maryland’s results cannot show how much came from lower prices because its program also controlled hospital revenue and volume. 3
A larger concern is that price caps may leave low-value care untouched. Much of the waste in healthcare can come from large quantities of relatively inexpensive services, rather than only from a few very expensive procedures. Evidence from Japan finds that low-cost, high-volume care contributes substantially to unnecessary spending. Cutting prices without reducing unnecessary use could therefore leave overall waste—and total spending—high. 4
The evidence also offers limited direct proof about narrow caps on selected services or insurers. The strongest examples involve comprehensive national rate-setting systems or global budgets, not isolated limits on individual medical prices. Results could vary with the market, the service involved, enforcement, access to care, and how providers adapt.
The bottom line
The evidence does not support the unqualified claim that medical-service price caps will significantly reduce overall healthcare costs. It favors a narrower conclusion with high confidence: comprehensive, coordinated regulation can restrain prices and may contain spending, especially when it also controls the volume and value of care.
The case for isolated price caps is considerably weaker. Lower unit prices may be offset by more services, shifts to uncapped care, coding changes, or continued use of low-value treatment. Maryland shows that a broader global-budget approach can change spending-related behavior, but it is not strong evidence that price caps alone caused those savings.
Overall, the evidence leans against treating price caps as a stand-alone solution. A credible cost-cutting strategy would need to pair administered prices with controls on unnecessary care, service volume, substitution, and the incentives created by the caps. There is not enough direct comparative evidence to estimate how much generic price caps would save across healthcare systems.
Pros — Supporting Arguments
Cons — Opposing Arguments
Figures & data

All contributions are reviewed for clarity, balance, and evidence. The strongest insights are elevated into the argument graph — with credit to you.
Help improve this analysis →