Should San Francisco Bay Area voters approve Regional Measure RTM? (November 3, 2026 ballot)
What's this about?
People disagree about whether Bay Area voters should approve Regional Measure RTM.
The plan would add a sales tax to help keep buses, trains, and ferries running.
What supporters say
- RTM would fill a real money gap that transit groups still face after the pandemic.
- Steady transit can help people who cannot drive and may cut car trips, jams, and dirty air.
- The plan sets rules for how groups share the money and checks how they spend it.
What critics say
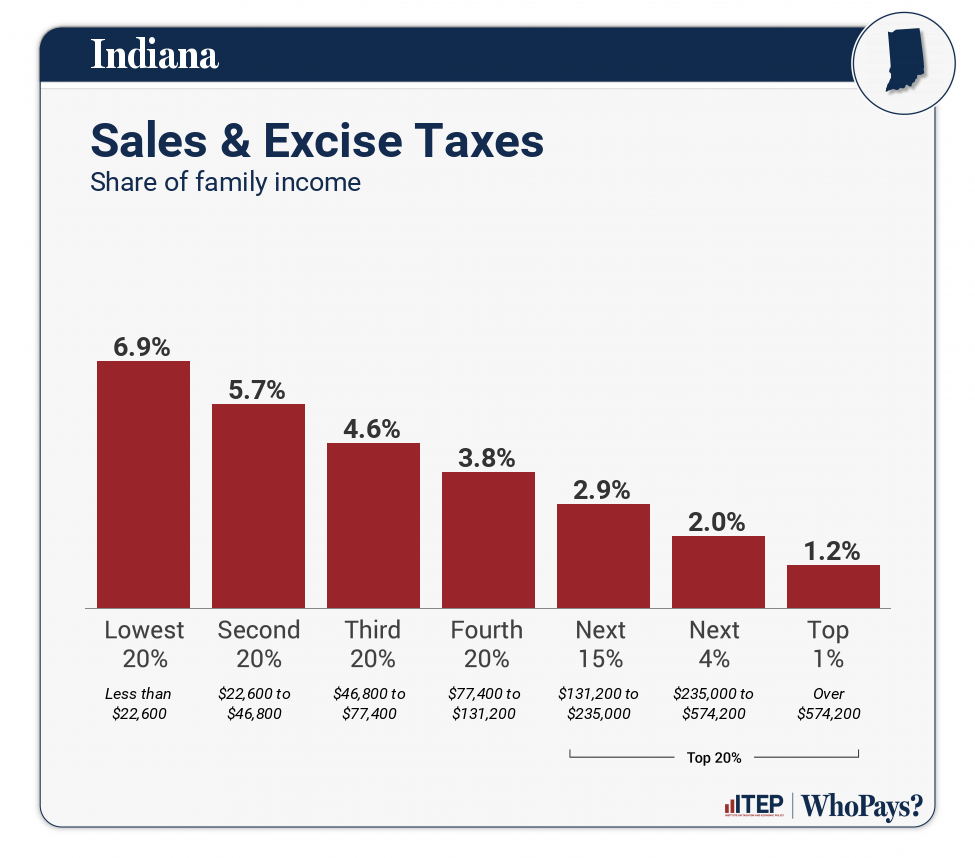
- Sales taxes can hurt people with low incomes more because they spend more of their money on needs.
- More transit money may not bring back riders or cut dirty air.
- New money might let transit groups delay hard changes they need to make.
How to read this
The number of points on each side does not show who is right; the strength of the proof matters more.
San Francisco Bay Area voters will decide on Nov. 3, 2026, whether to approve Regional Measure RTM, a time-limited sales tax intended to stabilize public transit. The measure’s benefits could be significant, but its tax burden and ability to produce lasting improvements remain uncertain.
The case for
RTM would address a real and persistent funding problem. The measure is expected to raise about $980 million a year for 14 years through a 0.5% sales tax in Alameda, Contra Costa, San Mateo and Santa Clara counties, and a 1% tax in San Francisco. Most of the money would support transit operations and related programs. Transit agencies continue to face lower ridership and fare revenue after the pandemic, suggesting that their financial problems are structural rather than a short-term gap. Regional data also show that the pandemic-era ridership shock has persisted (see Figure 2). 1
The strongest argument for approval is avoiding sharp service reductions. Reliable buses, trains and ferries help people who cannot drive, including low-income residents, older people and people with disabilities. Better transit can also replace some car trips, reducing congestion, noise and air pollution. Research on transportation improvements links expanded and higher-quality transit with greater transportation access and, in some settings, increased transit use. 2
RTM would not be an unrestricted transfer of money. Its proposed framework covers rail, bus and ferry service, reduced fares, accessibility and transit-priority programs (see Figure 1). It also includes county-level funding allocations, implementation plans, financial-efficiency reviews and an independent oversight committee. Those rules give voters a clearer spending plan and accountability structure than a general tax would. But their effectiveness would depend on enforcement, and they do not guarantee that every dollar will produce a matching improvement in service. 3
The case against
The main objection is that sales taxes generally fall more heavily on lower-income households. Research from the Institute on Taxation and Economic Policy and the California Budget & Policy Center finds that sales and excise taxes consume a larger share of low-income households’ earnings than of wealthier households’ income (see Figure 3). RTM includes reduced-fare and affordability programs, but the available evidence does not show that those benefits would fully offset the tax or quantify the measure’s net effect on households at different income levels. 4
Critics also worry that new revenue could preserve existing agency structures without forcing deeper changes in management, costs and service design. Bay Area transit agencies have already pursued cost cuts and new revenue, and regional reviews suggest those steps alone may not close the funding gap. Still, that does not prove all possible reforms have been tried or that RTM would deliver the most service for each dollar. Oversight is useful, but it does not by itself guarantee proportional results. 5
Finally, funding transit does not automatically restore ridership or reduce emissions. Travel patterns changed during and after the pandemic, and studies find that the effects of transit subsidies depend on local conditions and program design. Public spending also has opportunity costs; alternatives such as congestion pricing could produce different results. The available research therefore supports possible benefits from preserving service, not a guaranteed increase in riders, fewer car trips or lower emissions. 6
- Impartial analysis of Measure RTM acvote.alamedacountyca.gov
- First look at 2026 tax proposal to keep Bay Area transit running kqed.org
- BART is facing a financial deficit bart.gov
- BART faces toughest financial outlook in 50-year history governing.com
- The effects of the COVID-19 pandemic on transit in the San Francisco Bay Area doi.org
- Impartial analysis of Measure RTM acvote.alamedacountyca.gov
- Impacts of transit service strategies on passenger vehicle use and greenhouse gas emissions ww2.arb.ca.gov
- Public transit funding and transit use: a panel study of U.S. urbanized areas sciencedirect.com
- Impartial analysis of Measure RTM acvote.alamedacountyca.gov
- Impartial analysis of Measure RTM acvote.alamedacountyca.gov
- Who pays? 7th edition itep.org
- California's tax and revenue system isn't fair for all calbudgetcenter.org
- The Bay Area transit tax is a massive national outlier opportunitynowsv.org
Figures & data