Should Berkeley voters approve Measure AA? (November 3, 2026 ballot)
What's this about?
People disagree about whether Berkeley voters should approve Measure AA on November 3, 2026.
The measure would double the tax on sugary drinks and change how the city uses the money.
What supporters say
- Berkeley’s current tax led people to buy fewer sugary drinks.
- Computer models suggest the tax could prevent some long-term health problems.
- The money could pay for health, food, clean-water, city, and school programs.
- People with lower incomes may gain more health help if they drink more sugary drinks now.
What critics say
- We still have little proof that the tax improves health over many years.
- Researchers have not tested Measure AA itself.
- People might switch to other sweet drinks, which could weaken the health effect.
- People who keep buying these drinks may pay much of the tax.
How to read this
The number of points on each side does not show who is right; strong proof matters more than a long list.
Berkeley voters will decide Nov. 3 whether to replace the city’s existing soda tax with Measure AA. The measure would double the tax on sugary drinks from 1 cent to 2 cents per ounce and change how the money is collected and spent.
The case for
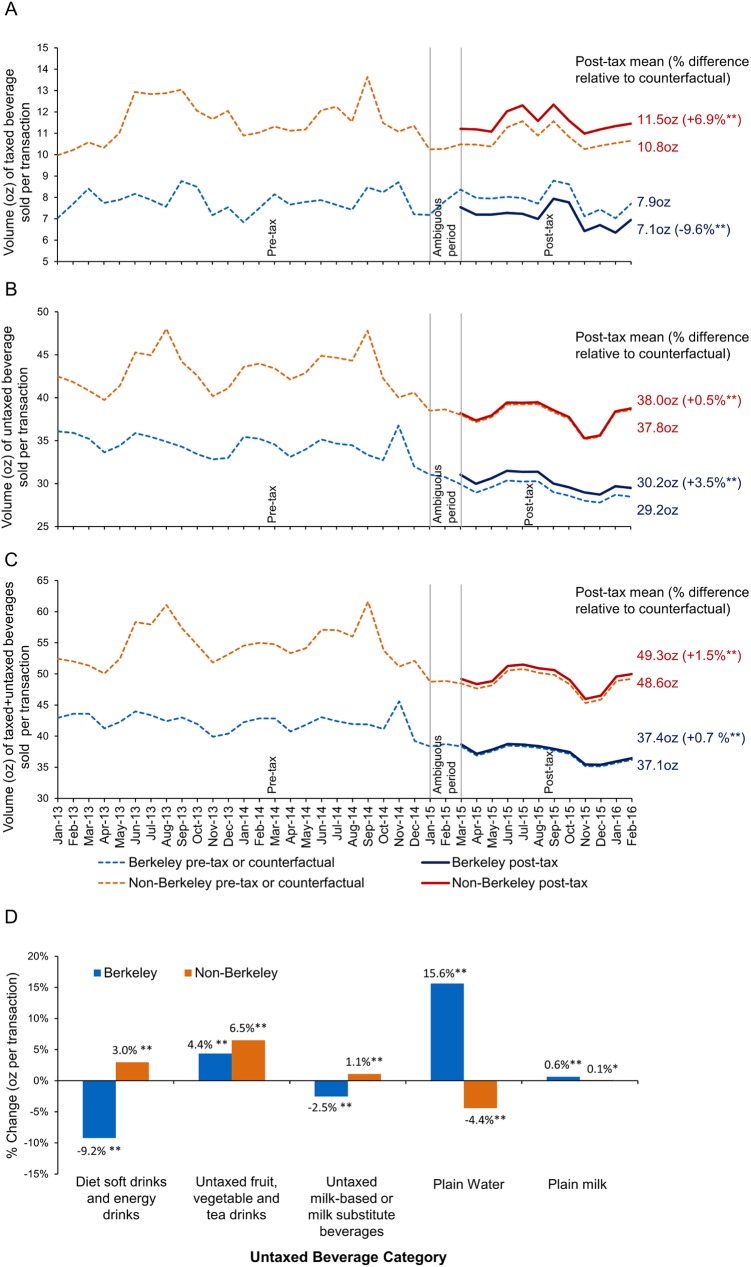
The strongest argument for Measure AA is that raising the price of sugary drinks appears to reduce purchases. A peer-reviewed evaluation of Berkeley’s existing tax found lower sales and consumption of taxed beverages after it took effect, while comparison communities saw increases. One summary reported a 9.6 percent drop in purchases in Berkeley, compared with a 6 percent increase elsewhere (see Figure 1). A national review of similar policies reached much the same conclusion: soda taxes generally raise prices and reduce sales, purchases and consumption, although the policies and communities studied varied 1 (see Figure 2).
Measure AA could also use its revenue to reinforce that price effect. Official ballot materials estimate roughly $2.2 million a year and allow the money to support public-health, nutrition, drinking-water, community, city and school-district programs. Research reviews suggest that such programs could complement a tax, especially because reducing purchases alone may not produce large health improvements.
The measure may bring larger behavioral benefits to lower-income residents, who in some cases consume more taxed beverages and therefore have more opportunity to reduce their purchases when prices rise. Berkeley evidence has reported reduced consumption in lower-income neighborhoods. But this also makes the design of the policy important, since those residents may face greater financial costs if they continue buying the drinks 3.
Health benefits are possible, though they are based mainly on projections rather than direct observation. A California cost-effectiveness model estimated that a 1-cent-per-ounce tax could prevent cases of obesity and diabetes and improve quality of life. That supports the idea that a stronger tax might prevent chronic disease, but it does not show what Measure AA itself would accomplish 4.
The case against
The main objection is that the evidence is much stronger for short-term changes in prices and purchases than for lasting health improvements. Reviews have found less direct evidence that soda taxes reduce body weight, diabetes or other long-term health outcomes. They also point to uncertainty about how long effects last, whether the tax itself caused them, and whether consumers change their overall diets.
Consumers who continue buying taxed drinks would pay more. Berkeley and other studies find that soda taxes are usually passed on to shoppers, sometimes at or above the legal rate. That makes the financial burden real for persistent purchasers, even if average consumption falls 6.
Substitution could further weaken the health effect. People may switch from taxed sodas to untaxed sugary products or other high-calorie drinks. As a result, a decline in purchases of taxed beverages may not equal an equivalent decline in total sugar or calorie intake 7.
Most importantly, no study directly evaluates Measure AA. Existing Berkeley research focuses mainly on the current 1-cent tax. Measure AA would double the rate, impose a different special-tax structure and create a new system for distributing the revenue. Research from other cities and economic models can explain likely mechanisms, but cannot establish the measure’s specific overall effect 8.
The measure would require at least 85 percent of funds to support community or city programs and Berkeley Unified School District grants, while allowing up to 15 percent for administration and implementation. But the ballot materials do not show which programs will receive the money, how effective they will be or how their results will be measured. A higher tax could reduce purchases further without producing proportionately larger health gains 5.
- Changes in prices, sales, consumer spending, and beverage consumption one year after a tax on sugar-sweetened beverages in Berkeley, California, US pmc.ncbi.nlm.nih.gov
- Impact of soda tax on beverage price, sale, purchase, and consumption in the US: a systematic review and meta-analysis pmc.ncbi.nlm.nih.gov
- Demonstrating Soda Tax Success: Reduced Consumption of Sugary Beverages phi.org
- City Attorney’s Impartial Analysis of Measure AA acvote.alamedacountyca.gov
- Sugar-Sweetened Beverage Taxes and Population Health Outcomes pmc.ncbi.nlm.nih.gov
- Impact of soda tax on beverage price, sale, purchase, and consumption in the US: a systematic review and meta-analysis pmc.ncbi.nlm.nih.gov
- Lessons Learned from Implementing a Sugar-Sweetened Beverage Tax in Berkeley, California poverty.ucdavis.edu
- The Incidence of Taxes on Sugar-Sweetened Beverages: The Case of Berkeley, California nber.org
- Economic Evaluations of Obesity-Targeted Sugar-Sweetened Beverage Taxes—A Review to Identify Methodological Issues doi.org
- Outcomes Following Taxation of Sugar-Sweetened Beverages jamanetwork.com
- The impact of sugar-sweetened beverage taxes on purchases and dietary intake: a systematic review and meta-analysis onlinelibrary.wiley.com
- Changes in prices, sales, consumer spending, and beverage consumption one year after a tax on sugar-sweetened beverages in Berkeley, California, US pmc.ncbi.nlm.nih.gov
- Impact of soda tax on beverage price, sale, purchase, and consumption in the US: a systematic review and meta-analysis pmc.ncbi.nlm.nih.gov
- City Attorney’s Impartial Analysis of Measure AA acvote.alamedacountyca.gov
- Economic Evaluations of Obesity-Targeted Sugar-Sweetened Beverage Taxes—A Review to Identify Methodological Issues doi.org