Anthropogenic warming will increase global catastrophic flood and heatwave frequency by at least 30% by 2036
Bottom line (updated 2026-08-30): The evidence clearly shows that warming will increase many heat waves and some heavy rains. But we're not sure yet that huge floods and heat waves together will rise by 30% worldwide by 2036.
What's this about?
People disagree about whether human-caused warming will raise huge, deadly floods and heat waves by 30% by 2036.
What supporters say
- Human-caused warming makes many kinds of very bad weather more likely.
- Heat waves will likely happen more often, last longer, and become stronger soon.
What critics say
- We know warming can make rainstorms stronger, but flood numbers remain harder to predict.
- No clear proof shows that floods and heat waves together will rise by 30% worldwide.
- Disaster counts can change because more people live in risky places and reporting has improved.
How to read this
The number of points on each side does not show who is right; strong proof matters more than a long list.
The bottom line
The evidence clearly shows that warming will increase many heat waves and some heavy rains.
But we're not sure yet that huge floods and heat waves together will rise by 30% worldwide by 2036.
The claim says human-caused warming will increase the global frequency of catastrophic floods and heatwaves by at least 30% by 2036. Evidence strongly supports a rise in many extreme events, but it does not clearly support that specific global percentage.
The case for
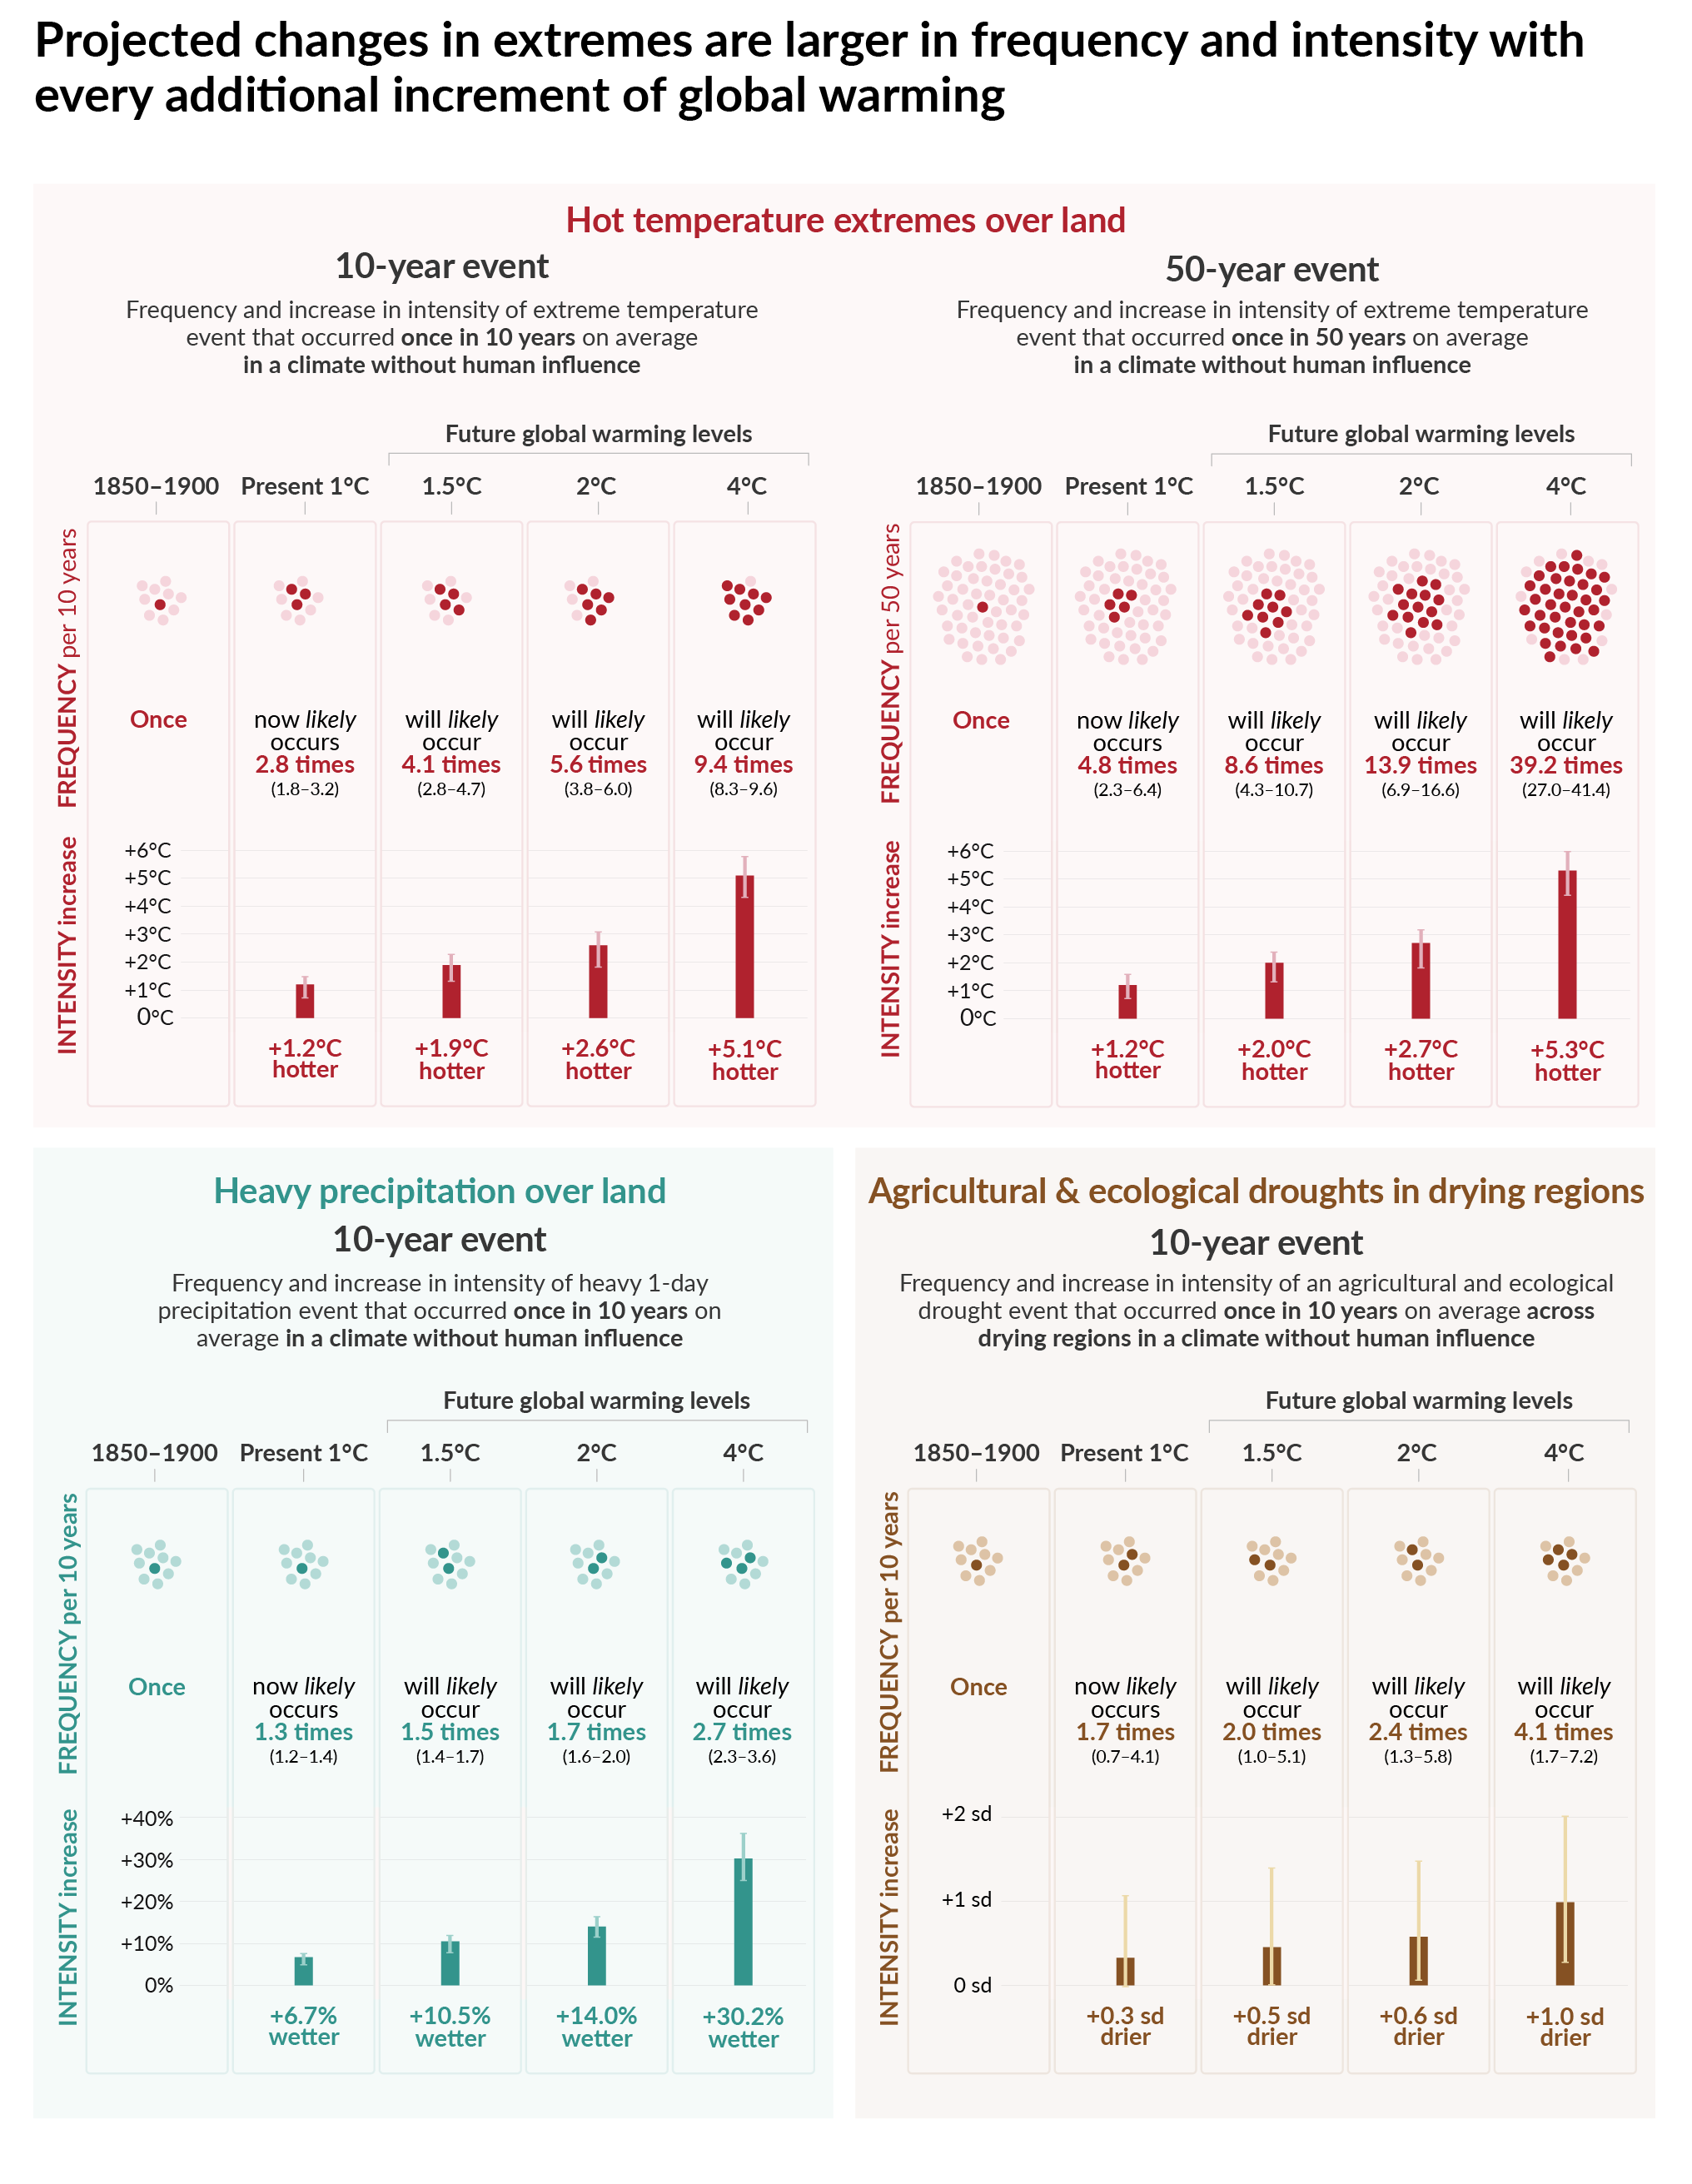
Climate change is already shifting the odds of extreme weather. The IPCC says with high confidence that human influence has increased the frequency and intensity of hot extremes and heavy rainfall in many regions. A warmer atmosphere can hold more moisture, increasing the potential intensity of downpours, while rising temperatures directly make extreme heat more likely. 1
Studies that examine individual events also often find that warming made particular heatwaves—and some heavy-rain events—more likely or more intense. Those findings establish a causal link for selected events, though they do not by themselves produce a global forecast of disaster counts.
The heatwave part of the claim has the clearest support. Climate models consistently project that heatwaves will become more frequent, longer and more intense as global temperatures rise. The WHO and IPCC reach similar conclusions, making an increase in some heatwave measures over the coming decade scientifically plausible (see Figure 2). Recent global conditions are also consistent with a warming-related increase in heat and other extremes, although observations of recent years cannot prove a particular future percentage (see Figure 3). 2
The case against
The main problem is the specific 30% global threshold. Major assessments usually make projections by region, warming level, climate scenario or type of extreme—not as one worldwide count of events classified as “catastrophic.” The claim does not define that category clearly enough for a direct test. No cited evidence establishes that the combined frequency of catastrophic floods and heatwaves will rise by at least 30% by 2036. 3
Floods are especially difficult to project. More intense rainfall can increase flood risk, but flood frequency also depends on soil moisture, snowmelt, river basins, land use, drainage systems, dams, river shape and human exposure. Global studies have found human influence on the timing of river flows, but that is not the same as showing a 30% rise in catastrophic floods. Regional results vary by location, season, watershed and research method (see Figure 1). 4
Recorded disaster totals are also an unreliable measure on their own. They reflect not only the physical hazard but changes in population, wealth, buildings, vulnerability, insurance, detection and reporting. A rise in officially recorded disasters might therefore reflect greater exposure or better reporting rather than more frequent floods or heatwaves. 5
The answer also depends on how “frequency” is defined. Counts of events exceeding a fixed temperature or rainfall threshold could rise sharply in some places. Counts of disasters defined by deaths or damage would also be shaped by adaptation, development and where people live.
The bottom line
The evidence favours the underlying direction of the claim, but not the claim as written. There is strong evidence that warming increases many heat extremes and can intensify heavy rainfall. Heatwave increases in the coming decade are more directly supported than increases in global catastrophic-flood frequency.
But the evidence for a combined global increase of at least 30% by 2036 is weak and not established. The central uncertainties are the undefined catastrophe measure, the lack of a common global baseline and the difficulty of separating changes in hazard frequency from changes in exposure and reporting. Confidence is high that warming affects extremes; confidence is much lower that it will produce the stated numerical increase.
Pros — Supporting Arguments
Figures & data

All contributions are reviewed for clarity, balance, and evidence. The strongest insights are elevated into the argument graph — with credit to you.
Help improve this analysis →